Gravimetric Monitoring
Quantifying groundwater masses variations by continuous gravity measurements
We aim at measuring changes in the water storage continuously, at periods ranging from a few minutes to a few months, with a precision of 1 mm, which is equivalent to 0.4 nm/s² (or 0.04 µGal), at periods ranging from a few minutes to years. At large scale, space born gravimetry allows quantifying water storage variations on continental scale basins; however, µGal (or 10 nm/s²) accuracy is still limited to wavelengths larger than 1000 km and the sampling rate is about 10 days. On the ground, ballistic absolute gravimeters have a noise level of 105 (nm/s²)²/Hz, which means that they are able to detect temporal gravity change of about 1 µGal (or 10 nm/s²) within 20 minutes
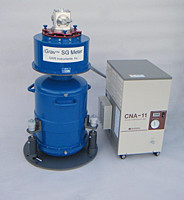
Because of mechanical wear, absolute gravimeters are not well-suited for continuous measurements lasting longer than a few days. In Rochefort, as the instrument ran for several weeks, which is not common, only one gravity data was measured every 270 minutes. This limited the resolution, in both amplitude and time domains. However, a superconducting gravimeter (SG)(Fig. 4) is able to monitor many more events, with a much better precision of 5 (nm/s²)²/Hz, corresponding to a precision of 0.2 nm/s² (or 0.02 µGal) at a period of 100 s. The sensing unit of an SG consists of a sphere levitating in a magnetic field generated by superconducting coils. The instrument measures continuously and the noise level is much lower (-20 dB at least) than conventional spring gravimeters. Its very low, regular drift (2-3 µGal/yr) can be estimated using episodic AG observation.
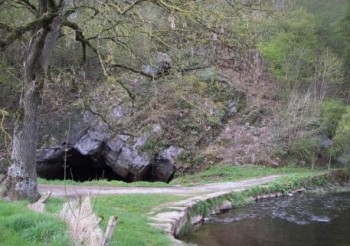
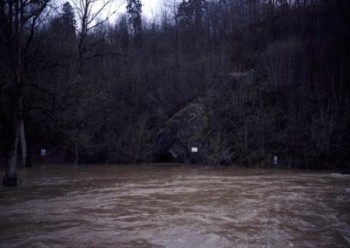
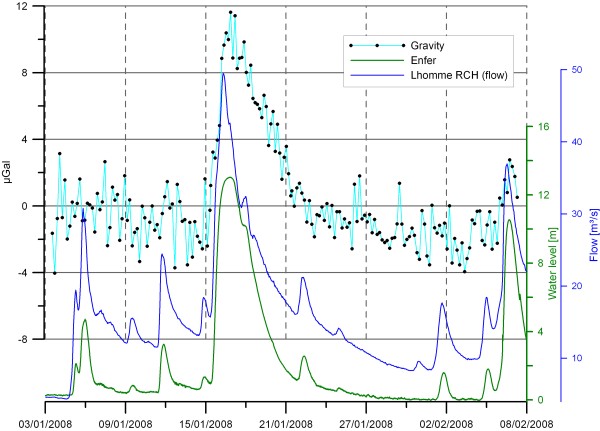
Of particular interest in Rochefort is the canalized Lomme River, which causes flash floods of the cave when the river spills off the dike (Fig 5 and 6). This provides dramatic rises in the hydraulic head, occurring in different conditions of saturation, for example after long lasting rainfalls in winter or after a summer thunderstorm, which can cause floods even when no rainfall is recorded above the cave. Hence, the continuous gravity measurements will allow investigating the dynamics of the karst, epikarst and infiltration zone as a function of the degree of saturation in the karst at different time scales, from flash floods events to seasonal and interannual scales.
The measurements provide useful insights on the masses of water below the instrument, but cannot uniquely resolve the mass distribution at depth. To better determine the vertical distribution of the water storage in the epikarst, we will perform time-lapse gravity measurements between the cave, at about 40 m depth, and the surface. Combining the continuous gravity measurements at the surface and time-lapse microgravimetry with well-logging and the other hydrologic and geophysics measurements will allow separating the water storage changes in the epikarst and infiltration zone above the cave from changes in the epiphreatic and phreatic zone below the cave. We also plan, during a season, to perform continuous gravity measurement in the cave using a gPhone, in collaboration with the U. Luxembourg.
As 90% of the gravity effect derives from within 5 times the vertical separation between the gravimeters, this means that 90% of the signal will come from a cylinder with about 200 m radius at the Rochefort site.
Gravity measurements performed in the Larzac and Rochefort
Absolute gravity measurements were performed on the ground surface above the Rochefort cave during 4 winters. When the Lomme River spilled over its dyke and flooded the cave, this caused dramatic and nearly instantaneous increases in the hydraulic heads in the cave, reaching 13 meters. Meanwhile, gravity increased by 12 μGal, while at least 25 μGal were expected. A first conclusion is that during these sudden floods, the pores and fine fissures were poorly connected with the enlarged fractures, cave, and conduits, or that the porosity is lower than expected. These measurements were not continuous, which did not allow monitoring the response of the karst system as a function of its degree of saturation. Concurrently, gravity measurements are also performed since June 2006 on the Larzac plateau by the U. Montpellier, revealing water storage changes at seasonal and interannual time scales. Repeated gravity measurement quantified the importance of the epikarst for water storage and the important water storage variations on the Larzac plateau. The Larzac and Rochefort systems are quite different: the Larzac system is larger by one order of magnitude and is characterized by a widespread infiltration trough the epikarst, while in Rochefort the water inputs are mainly localized (Nou Maulin swallow hole).
Geoelectical Monitoring
Infiltration monitoring
Since Electrical Resistivity Tomography (ERT) is able to image ground resistivity variations and that these variations are strongly dependent on the water content and its conductivity, electrical resistivity tomography (ERT) is a suitable way to image the water distribution within the epikarst. ERT monitoring also allows retrieving information on water dynamics in karst. A supplementary method is a sprinkling experiment already applied in some karst systems to infer the water dynamics, especially the water retention in the unsaturated zone and the major flowpaths. Self-potential (SP) measures are also of interest as water infiltration in the ground is responsible for measurable self-potential (SP) signals. This allows detecting preferential infiltration pathways. Finally, the water dynamics is also investigated through environmental monitoring above and within caves, among other through tracers monitoring in cave drips.
Monitoring changes in groundwater content and flows in the epikarst
For a better understanding of the infiltration processes within the epikarst, a continuous monitoring of spatial and temporal changes in the water content within the epikarst is necessary. An ERT monitoring system will be installed to image, at least on a daily basis, the spatial variability of resistivities due to the complex geometry of the epikarst. This system will be complemented by a network of buried temperature sensors to correct thermal effects on resistivities. Additionally, SP signals will be measured to obtain information about water flows in the epikarst through the electrokinetic effect. The ground moisture will also be monitored locally through a network of time domain reflectometry (TDR) and water conductivity probes. Discharge, temperature and conductivity of the water that percolate thought the epikarst will be monitored at different sites using flow recorders inside the cave.
These repeated measurements will be used to constrain and interpret the results of the ERT images in terms of ground water content. Together with onsite precipitation data and infiltration monitoring within the cave, this should lead to a better understanding of infiltration dynamics and water redistribution within the epikarst. We will also rely on the available long series of water flow being recorded through stalactites in the RCL as well as local meteorological data.
Additionally, we plan to conduct fluorescent tracer tests thought the surface and the cave passages and to image with ERT the effects of sprinkling of a known amount of water of controlled conductivity (salt tracer test) to provide insights into the retention zones and preferential flowpaths in the epikarst. These experiments shall be conducted in different moisture conditions in the epikarst.